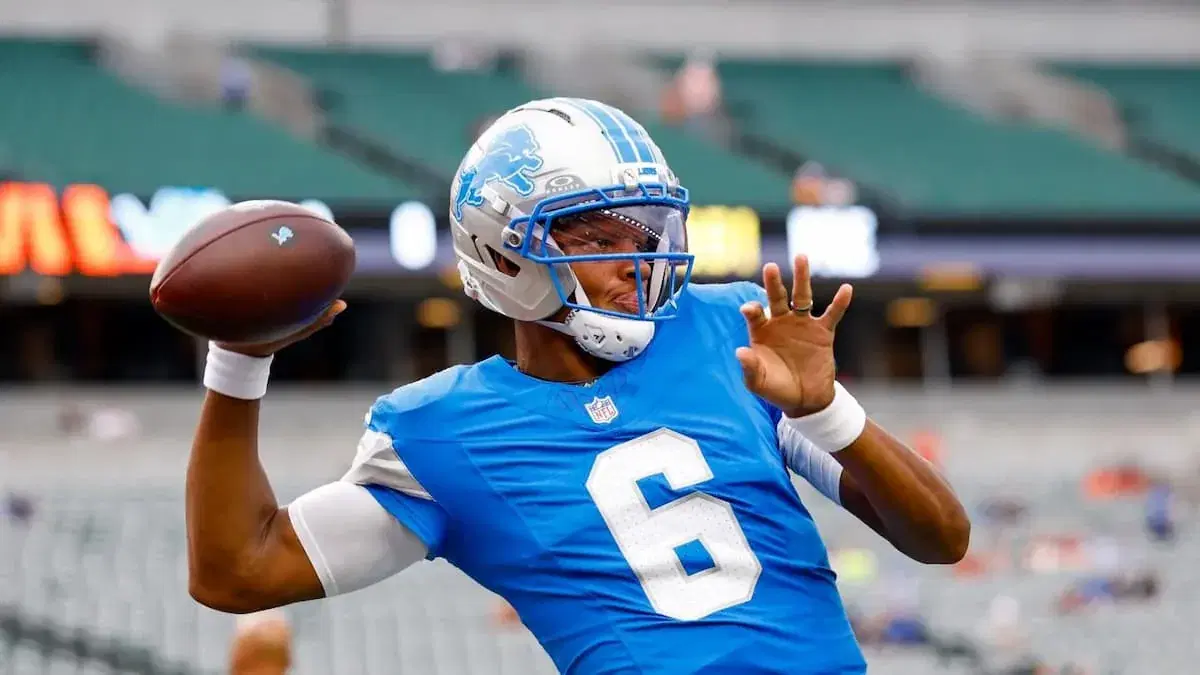
Detroit Lions vs Indianapolis Colts Picks & Odds

NFL - FINAL

Lucas Oil Stadium, Indianapolis

Detroit Lions logo
FINAL
Indianapolis Colts logo
Detroit Lions
25
Indianapolis Colts
16

Best Odds

Preseason Comes to a Close: NFL Preseason Expert Picks for 8/29

Preseason Comes to a Close: NFL Preseason Expert Picks for 8/29 - Nate Hornung

Consensus Picks

Weather Forecast

Not applicable
New! The BN NFL Computer Picks analyzes each matchup using team performance ratings to project win probability, fair odds, score, spread and game totals.

BN Computer Picks

Projected Winner

Detroit Lionsto win
Confidence
More information
Model confidence indicates the strength of the NFL model's prediction.
79%(Strong edge)
Detroit Lions logo

Detroit Lions


65%

BN Fair Odds

More information
Fair odds are the odds implied by our prediction model. They are not sportsbook odds. They show what we think the price should be based on the projected win probability.

-186

Moneyline Edge

★ +151

Predicted Score

24.5

Model Spread

-2

Indianapolis Colts logo

Indianapolis Colts


35%

More information
Fair odds are the odds implied by our prediction model. They are not sportsbook odds. They show what we think the price should be based on the projected win probability.

BN Fair Odds

+186

Moneyline Edge

—

Predicted Score

22.4

Model Spread

+2

Team Ratings

DET (Away)vsIND (Home)

Strong91.2

Pass Offense

Weak19.8
Below Avg39.4

Pass Defense

Average45.2
Above Avg67.1

Rush Offense

Above Avg69.0
Average49.1

Rush Defense

Below Avg38.6
Weak (0–25)
Below Avg (25–40)
Average (40–55)
Above Avg (55–70)
Strong (70+)

NFL ratings compare each team's passing and rushing offense and defense. Ratings are percentile-based from 0–100.

Betting Records

DET

DET

IND

IND

5 - 3(9th)

1 - 3

Wins

Away/Home

(29th)2 - 7

1 - 3

4 - 4 - 0(16th)

2 - 2 - 0

ATS

Away/Home

(12th)5 - 4 - 0

1 - 3 - 0

4 - 3 - 1(15th)

2 - 1 - 1

Ov / Un

Away/Home

(2nd)6 - 3 - 0

3 - 1 - 0

Offensive Stats

DET

DET

IND

IND
240
Points
189
25
Touchdowns
15
7.65
Yards per Play
6.58
2110
Passing Yards
1718
278
Pass Attempts
298
183
Pass Completions
174
11.53
Yards per Pass
9.87
15
Pass Touchdowns
4
988
Rushing Yards
1041
224
Rush Attempts
247
4.41
Yards per Rush
4.21
10
Rushing Touchdowns
11
3
Interceptions
9
19
Sacks
22

Defensive Stats

DET

DET

IND

IND
210
Points
252
23
Touchdowns
22
7.38
Yards per Play
7.46
2286
Passing Yards
2094
320
Pass Attempts
276
213
Pass Completions
172
10.73
Yards per Pass
12.17
17
Pass Touchdowns
13
727
Rushing Yards
1118
193
Rush Attempts
255
3.77
Yards per Rush
4.38
6
Rushing Touchdowns
9
4
Interceptions
2
25
Sacks
16

Last 5 Games

DETDET

Result

ATS

Total

vs GB

W17 - 20

L-3.5

54.5

@ ARI

W45 - 21

W-5.5

54

@ CAR

L26 - 32

L-3.5

57

vs NYJ

W24 - 31

W-6.5

48

@ BUF

L31 - 41

L+5.5

P72

INDIND

Result

ATS

Total

@ MIN

L10 - 16

W+6.5

41.5

vs TEN

L26 - 20

L-6.5

44

@ PIT

L22 - 34

L+2.5

43

@ WSH

W30 - 13

W-4.5

46

vs HOU

W17 - 19

W+1.5

42

More NFL Articles